Inside Digital Foundry: How we measure console frame-rate
The performance analysis toolbox revealed.

It's one of the most frequent questions we get asked at Digital Foundry - especially on our YouTube channel. Just how do we measure console frame-rate and create our performance videos? Is there some kind of console equivalent to the classic PC performance tool, FRAPS? It's a long story, and one we've partially covered in the past, but one of the aspects that most excited me about expanding our video output was the opportunity to use the medium to demystify a lot of what we do, to show our tools and processes. And that begins right here.
The tools have developed immensely since we first started analysing console performance back in 2008, but the basic principle hasn't changed. We use a high-end capture card to grab uncompressed video direct from the HDMI ports of our sources, and compare each individual frame to the one before it, searching for duplicate data, locating tear-lines, and calculating frame-rate from there.
Initially, we just had a command line tool - FPSdetect.exe - that could scan a captured video and tell us how different one frame was from its predecessor - effectively all the data you need to analyse games running with v-sync active. This was later joined by FPSgraph.exe, another command line tool that used the .txt files generated by FPSDetect to create transparent TIFF files with the familiar graphs. That's one TIFF per frame, overlaid onto the source video in Adobe After Effects - it was pretty torturous to work with and preview options of the final video were limited. Any errors in the calculations required manual editing of the .txt file, and a repeat of the whole enterprise. We needed to streamline the process, so we went one step further with the beginnings of the tool showcased in the video below - FPSGui.
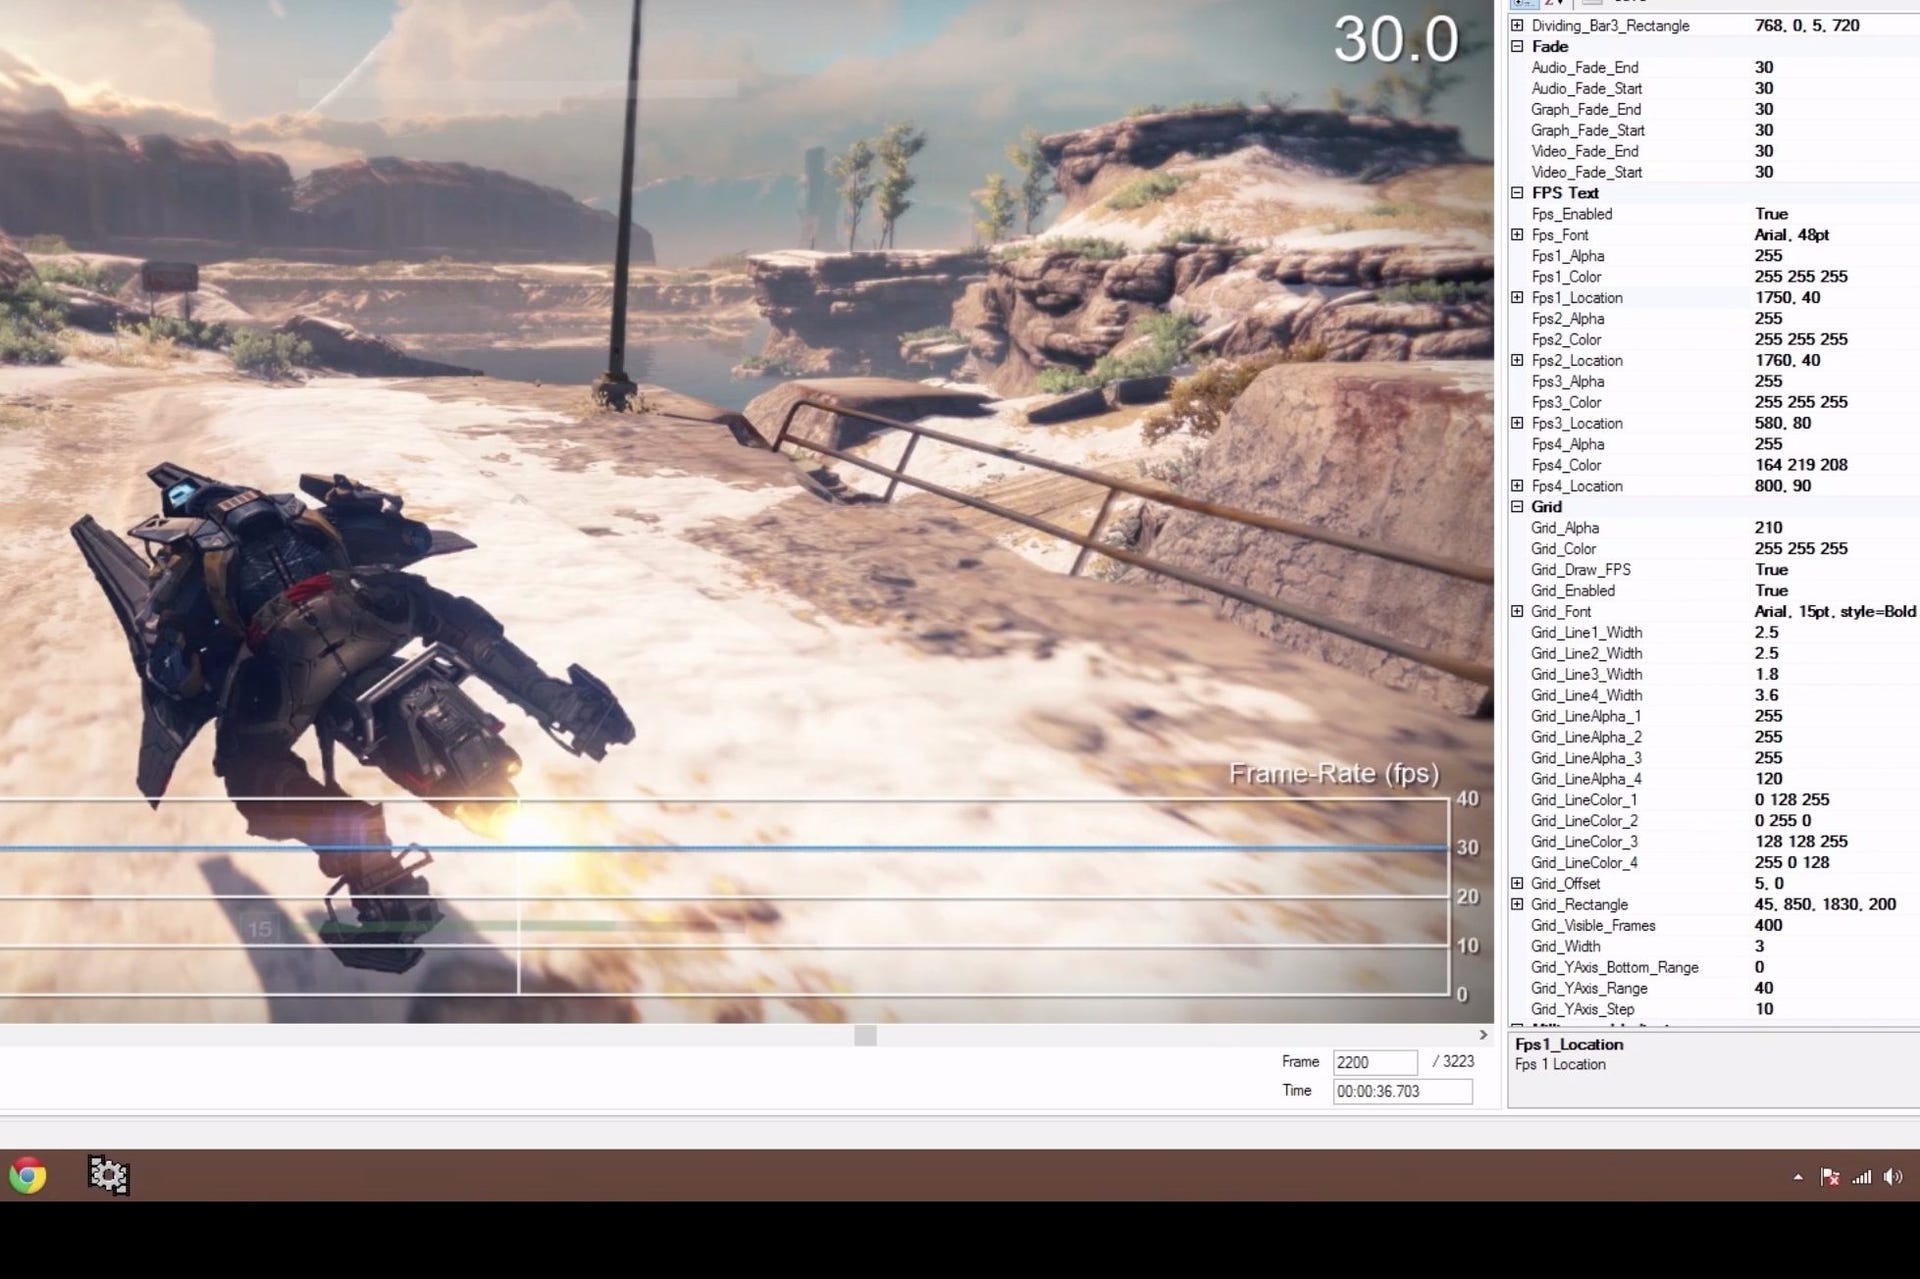
It consists of two major elements: the initial editor allows us to define the look of the video, in terms of the graphs, fonts and the number of videos (single, or multiple split-screen options - we currently support up to four sources). And then there's the viewer, containing analysis data for each imported capture, along with several visualisation modes. There are many challenges in getting an accurate analysis - finding tear locations is one of them, and those viewing modes are very helpful in ensuring accuracy.

In theory, calculating tear-line location is a simple case of comparing each frame with its predecessor on a line-by-line basis, looking for blocks of common data. In practice, a number of additional variables can make life a lot more difficult - sometimes HDMI data is 'dithered', meaning that duplicate frames are no longer mathematically identical. Games running at 60fps with adaptive v-sync can also see tear-lines appearing where there is no common data with the previous frame, making a programmatic approach to locating them difficult (Titanfall taught us a lot about this). Very rarely, a new game arrives presenting in an entirely different manner to anything we've seen before, meaning that some manual correction or a change in import parameters is required. And that's where our heat-map and absolute difference viewing modes help immensely, allowing us to view the captures in a 'black and white' manner similar to how the algorithm operates.
Checking for potential errors is also helped immensely by the frame-time graph, which visualises exactly how long any given image remains on-screen. Frame-time is enormously important for representing the 'in the moment' experience - effectively, it highlights hitches and stutters during gameplay and it's also essential in verifying good frame-pacing, but it's also useful for us in making sure that the analysis is accurate, in that potential oddities are highlighted. 16ms frame-time spikes in a 30fps game... really? 50ms stutter in a 60fps game? That's odd and should be checked out. The vast majority of titles scan in to FPSGui and export out again with no real issue, but over the years we've found that as good as our algorithms are, sometimes external variables cause problems on a small number of titles - and that's where our visualisation modes are required to fully understand what's going on. At the end of the day, it's all about human verification of the algorithm's results in order to ensure accuracy.
The last major revision to our tools added support for Nvidia's FCAT - an overlay for PC that marks up every individual frame with a different coloured border, making tear-line detection a doddle. This also allows us to present benchmarking in video form, giving us a much greater insight into PC performance and where the bottlenecks lie. We've also carried out some work that allows us to analyse compressed sources - like publisher b-roll, for example. The tool has benefited from cumulative development work going back years now: a host of features have been added, but many (such as cleaning up screen-tear) just aren't needed any more, while game-specific tweaks we've made have been rolled into our main algorithms.
We have all of the core functionality we need, but as the new features have piled in, the interface is a little messy, and faster imports and exports are always welcome. On top of that, we're now capturing 4K video at 60fps, taking memory requirements to a whole new level. With all that in mind, FPSGui is being revamped as a 64-bit application, with all the add-ons, fixes and enhancements made since 2008 rolled into a faster, more streamlined and efficient tool - also designed with an eye towards our future requirements. And fingers crossed, that'll keep us sorted for another seven years...