DF Weekly: re-assessing benchmarking and PC gaming coverage
Intel's new tools are potentially a game-changer for what we do.
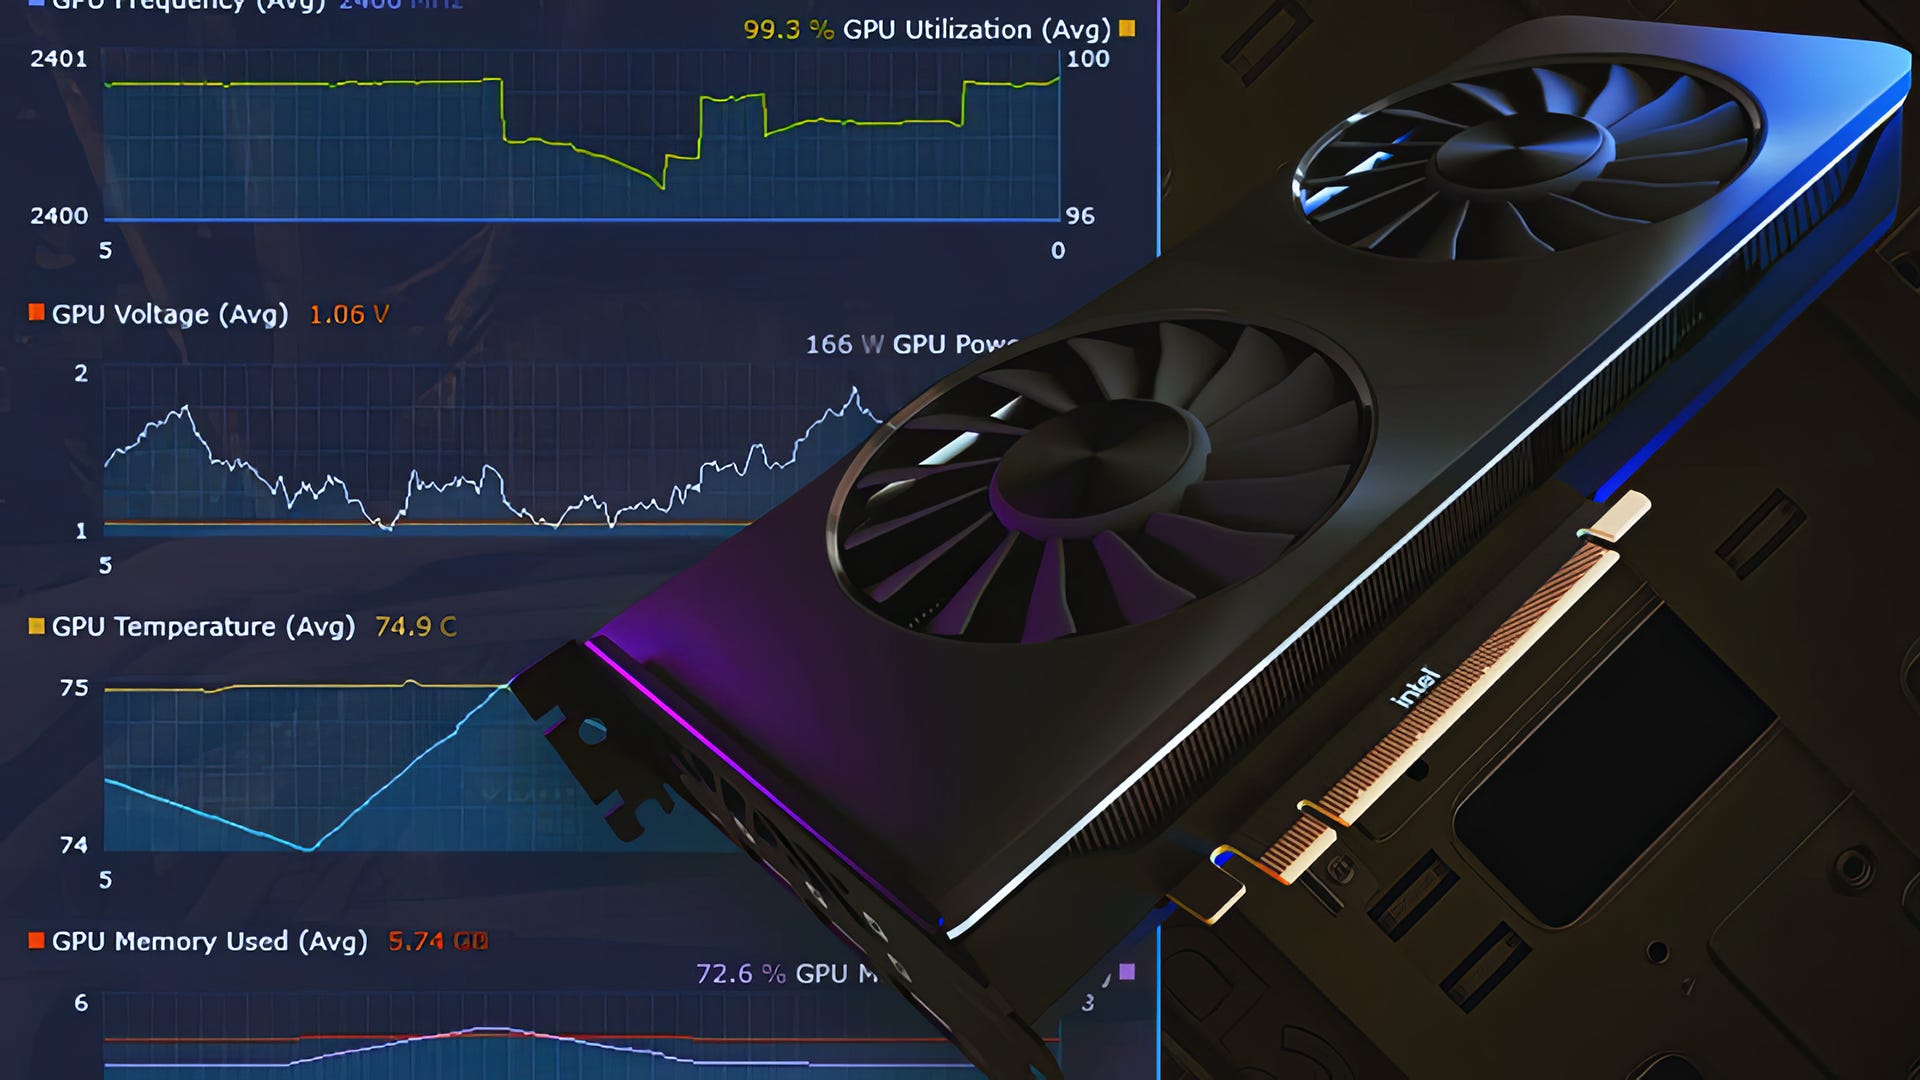

Another Monday, another episode of DF Direct Weekly. Myself, John Linneman and Alex Battaglia battle our way through the topics of the week, including initial reactions to the Hellblade 2 previews from last week - but what I want to talk about here is how Alex spent his time last week. Within this week's Direct, you'll see his tests with Intel's PresentMon 2.0, which may well change the face of PC benchmarking... to a certain degree, at least.
PresentMon forms the basis of just about every reputable benchmarking tool out there. Intel pioneered it and adds new features (more about that shortly) but it's used by the likes of CapFrameX, AMD OCAT and even Nvidia FrameView. All of them mix and match various features but it's PresentMon at the core of it, which makes the latest additions interesting. We first caught site of them in a video put together by Gamers Nexus and we've also seen the new features used 'in anger', so to speak, in GN's excellent performance review of Dragon's Dogma 2.
First of all, let's talk about PresentMon more holistically. It's a great tool. Essentially it gives accurate frame-time readings for any given benchmark run, it calculates frame-rates and the various percentiles used in most GPU and CPU reviews (bar ours - we still test based on actual frames that emerge from the PC). You also get great metrics on important factors including power consumption, CPU core utilisation and more. Much more. Intel's first major change was to implement what it calls 'CPU Busy' and 'GPU Busy'. Rather than just telling you how long it takes to render and present a frame, we could now see how much of the time was occupied by CPU and GPU in delivering any given frame - invaluable in ascertaining the overall balance of your system.
With these two variables, you can aim for 'balance' - which is to say, maximising utilisation of those components to achieve peak performance. Personally, at DF we tend to be more interested in consistency, delivered either via a more rigourous lock to a target frame-rate (eg 60fps or 120fps) or else ensuring that the game is always (or as close to it) GPU-limited. Any given frame tends to present similarly to the one before and after it, meaning consistent frame-times and a perceptually smoother experience, good for VRR monitors. In comparison, being CPU-limited almost always results in egregious stutter.
- 0:00:00 Introduction
- 0:01:04 News 01: Hellblade 2 previews drop!
- 0:26:53 News 02: PS Portal hack patched before release
- 0:34:41 News 03: 90s FPS PO'ed getting Nightdive remaster
- 0:41:07 News 04: C-Smash VRS hits Meta Quest
- 0:52:03 News 05: Alex’s PresentMon experiments
- 1:06:57 News 06: Campaign demands: stop killing games!
- 1:16:19 News 07: Intel updates XeSS with revised modes
- 1:22:04 Supporter Q1: Would it be more practical to target 1440p than 4K for performance modes?
- 1:28:11 Supporter Q2: Dragon’s Dogma 2 has unimpressive NPC density, so why can’t it hit 60fps on consoles?
- 1:35:17 Supporter Q3: Why do some developers implement incorrect 30fps frame-rate caps?
- 1:43:36 Supporter Q4: Why isn’t low frame-rate compensation the default with 120Hz and VRR on PS5?
- 1:50:05 Supporter Q5: Could the PS5 Pro be powerful enough to run advanced path traced games?
- 1:55:04 Supporter Q6: With Microsoft potentially opening Xbox to third parties, was the 3DO approach right all along?
- 2:01:21 Supporter Q7: Would it have been better to forgo the PS5 Pro and instead shorten this console generation?
Another interesting new data point is 'click to photon' latency, which is essentially the time taken from user input to register on-screen. Nvidia has this function within its own FrameView tool based on 'markers' the developer needs to add to their code (which happens naturally if using DLSS 3 frame-gen). Intel's solution should 'just work'. Latency monitoring is crucial for not just telling you why a game feels poor to control but to put an actual number on it, something that's highly time-consuming to do without internal metrics.
So, the case for upgrading our existing frame-capture based benchmarking is strong - we pride ourselves on ensuring that our data is as close to the gameplay experience as possible, meaning that nothing can trump results derived from the output of the GPU, acquired via capture card. However, the sheer wealth of data from PresentMon makes a strong case for using this instead (or indeed merging it with our own tools). On top of that, the recently released PresetMon 2.0 has another new innovation: animation error. This is a form of stutter that may or may not actually present in video output.
In this week's Direct, Alex talks about the infamous Star Wars Jedi: Survivor. Even if we get the game running locked to 60 frames per second, motion looks subjectively 'off'. Looking at CPU Busy in relation to GPU Busy shows that while the GPU is running fine, the CPU clearly having issues with consistency. In short, PresentMon is giving us objective data that is explaining the subjectively poor experience. And that's just the beginning - with a more holistic look at all areas of PC performance, further insights may emerge.
However, I'd also argue that the sheer amount of data is potentially overwhelming to the end-user, meaning that using PresentMon's current on-screen visualisations only has a certain amount of utility for the work we do - so perhaps the way forward is to revamp our current graphing tools to present the new data more clearly, and allow us to pick and choose what variables are shown in order to highlight the points we are making.
So far, we've been talking about game reviews, but the 'all the data, all the time' aspect of PresentMon working in concert with our real-time graphing set-up means we can visualise whatever data we want, but also do so with multiple inputs (different GPUs for example). Right now, we capture frame-time metrics but that might not be the whole story. An AMD and Nvidia GPU may perform identically, but other aspects like CPU load or power consumption could be very different. A frame-rate graph showing identical performance gives a different impression to one that also includes real-time power consumption metrics that may show one card having a distinct advantage over the other.
This is just the beginning of the conversations we're having in Digital Foundry at the moment as we consider transitioning away from a system we've been using (with various upgrades) since 2013. Our current frame capture system integrates with the Eurogamer graphing system to dynamic generate barcharts and frame-time readings based on our captures, but with the data in PresentMon, the sky's the limit in terms of improving component reviews or even offering up product recommendations. It's early doors, but the ambition is there and the core tools are just getting better and better.