AMD Ryzen 9 5900X and Ryzen 7 5800X review: eliminating Intel's gaming advantage
Macroevolution.
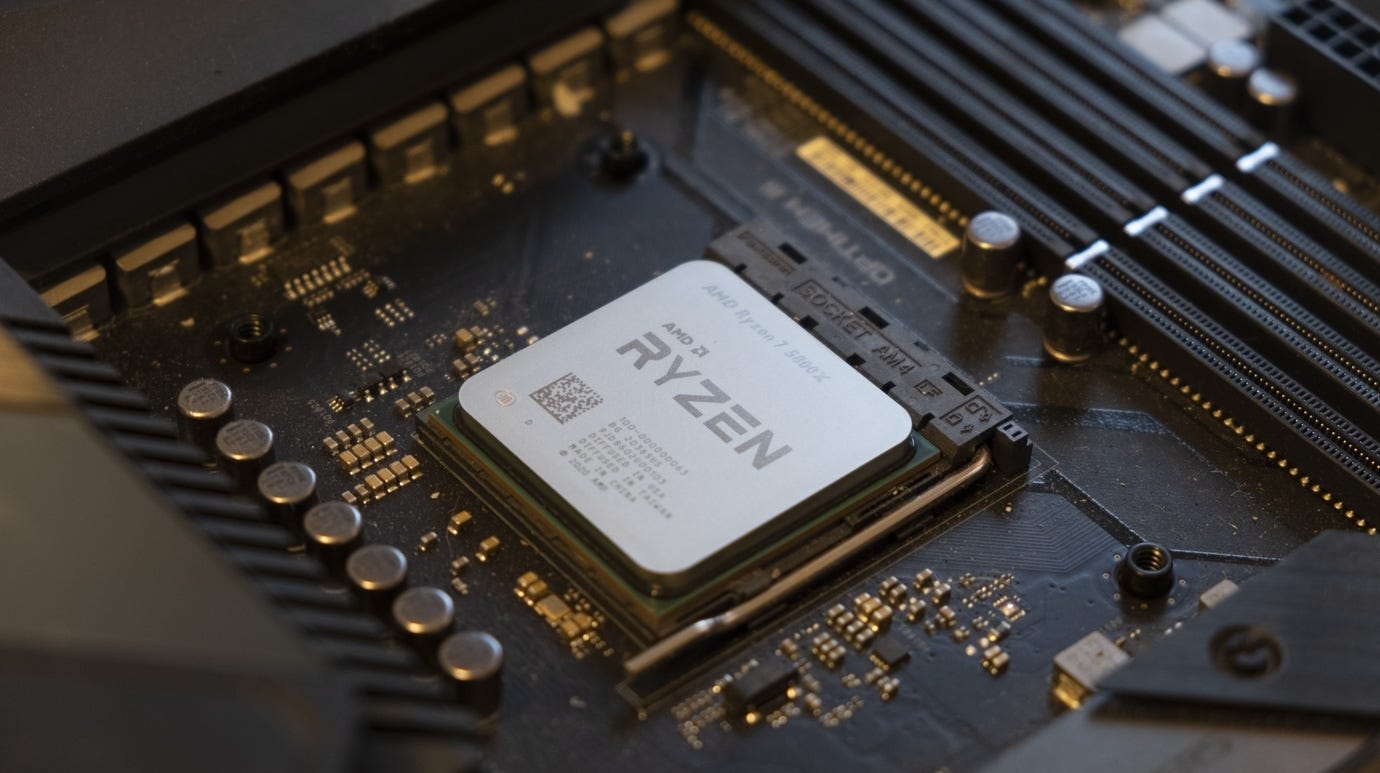

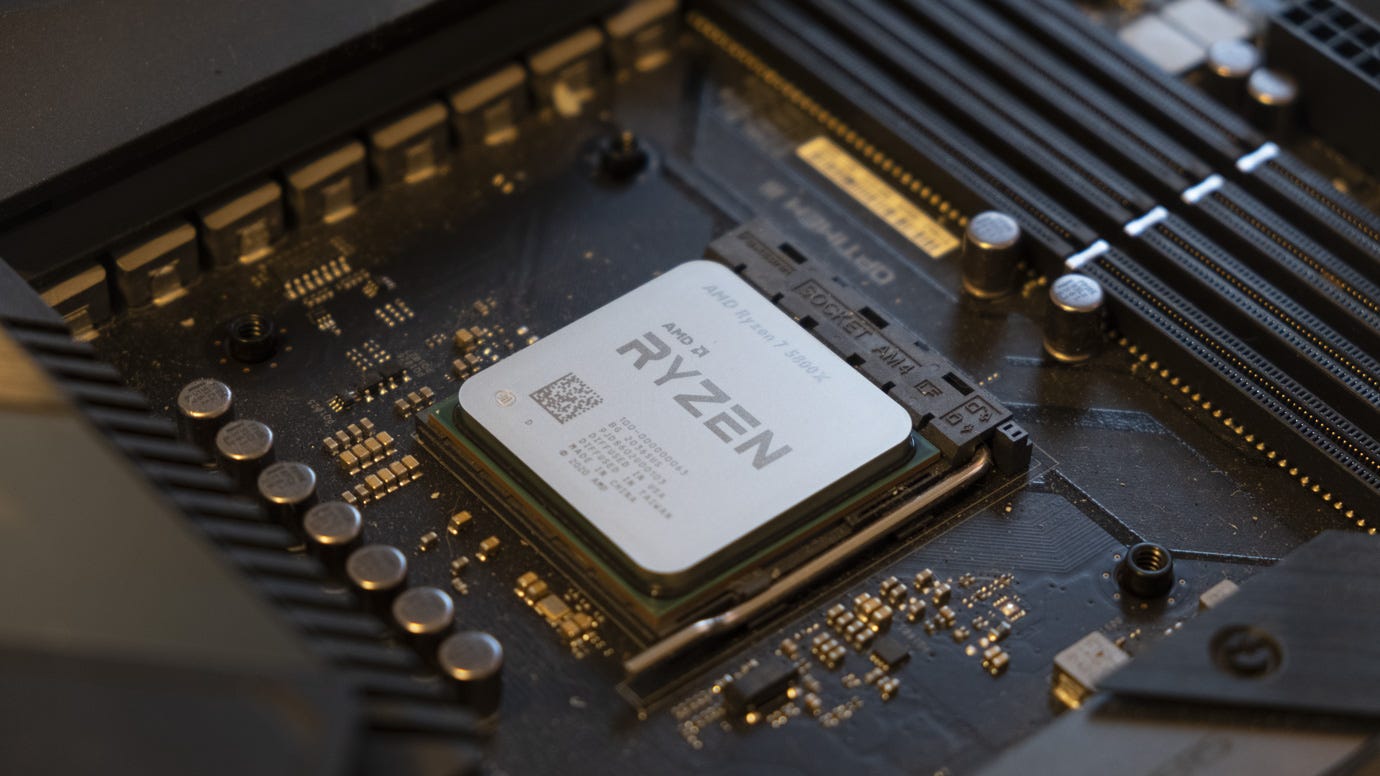
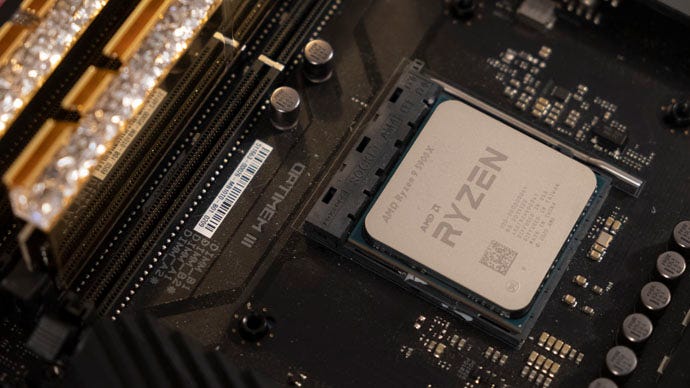
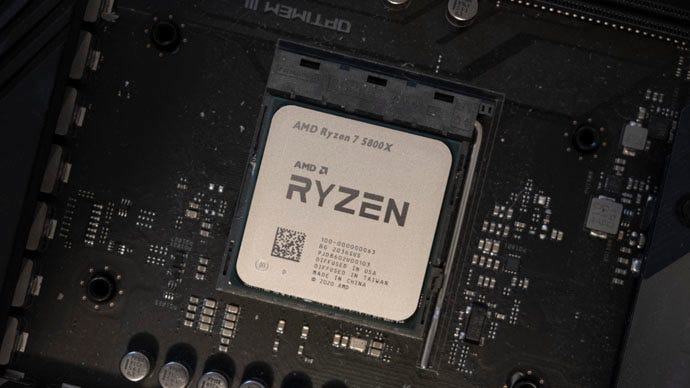
We've loved AMD's Ryzen processors for their high core counts and excellent value, but they've had one major weakness since their first generation: worse gaming performance than Intel, due to slower single-core speeds. Each subsequent Ryzen release has narrowed the gap, but Intel has held onto the gaming crown with grim determination - until today. AMD's new Ryzen 5000 processor lineup has finally equalised with Intel when it comes to single-core performance, meaning this is the moment that Ryzen can earn our full-throated recommendation for gaming.
In this piece, we'll be reviewing the two Zen 3 chips we've received ahead of launch: the mid-range Ryzen 7 5800X and the high-end Ryzen 9 5900X. (The mainstream Ryzen 5 5600X and flagship Ryzen 9 5950X should be detailed in an upcoming review.)
We'll be putting them through our CPU benchmarking suite, which was originally designed to prove that even Intel's then-flagship, the Core i7 8700K, wasn't able to run all games at 60fps. It just so happened that this suite also highlighted Ryzen's gaming deficiencies more than most canned benchmark sequences used elsewhere - so consider it a super tough workout that will provide final validation that AMD has done it.
So how are AMD able to claim such a big shift in performance from Ryzen 3000 to Ryzen 5000, considering that both processor lines are made using the same 7nm process? While there have been lots of changes behind the scenes, one major reason is that Zen 3 core complexes now contain up to eight cores each, rather than the up to four cores we saw on Zen 2. That means six and eight-core designs, like the Ryzen 5600X and 5800X, never need to send data through the relatively slow Infinity Fabric interface to reach a distant core, while larger designs like the 5900X at least take that performance penalty less frequently. It also means that all eight cores in a Zen 3 CCX have access to the same 32MB of L3 cache, compared to Zen 2 where the 32MB was split between the two complexes. As these are architectural changes, AMD hasn't needed to resort to pushing more power into the chip, so rated TDPs for each processor remain the same as the last-generation examples.
| CPU design | Boost | Base | Cache | TDP | RRP | |
|---|---|---|---|---|---|---|
| Ryzen 5950X | Zen 3 16C/32T | 4.9GHz | 3.4GHz | 72MB | 105W | $799 |
| Ryzen 5900X | Zen 3 12C/24T | 4.8GHz | 3.7GHz | 70MB | 105W | $549 |
| Ryzen 5800X | Zen 3 8C/16T | 4.7GHz | 3.8GHz | 36MB | 105W | $449 |
| Ryzen 5600X | Zen 3 6C/12T | 4.6GHz | 3.7GHz | 35MB | 65W | $299 |
| Ryzen 3950X | Zen 2 16C/32T | 4.7GHz | 3.5GHz | 72MB | 105W | $749 |
| Ryzen 3900X | Zen 2 12C/24T | 4.6GHz | 3.8GHz | 70MB | 105W | $499 |
| Ryzen 3800X | Zen 2 8C/16T | 4.5GHz | 3.9GHz | 36MB | 105W | $399 |
| Ryzen 3700X | Zen 2 8C/16T | 4.4GHz | 3.6GHz | 36MB | 105W | $329 |
| Ryzen 3600X | Zen 2 6C/12T | 4.4GHz | 3.8GHz | 35MB | 95W | $249 |
| Ryzen 3600 | Zen 2 6C/12T | 4.2GHz | 3.6GHz | 35MB | 65W | $199 |
We'll discuss value in more detail later on, but for now it's worth mentioning that each of these Ryzen 5000 processors debuts at a launch price $50 higher than its predecessors. Combined with the fact that third-gen Ryzen has been solidly discounted - when supply allows - over the past twelve months, and you're looking at a significant price difference between current and next-gen offerings. For example, the Ryzen 3900X currently sits at £384 on Amazon UK, down from its launch price of £499, and the new 5900X costs £510 at pre-order. That's a 25 per cent margin, and it could well expand if there isn't sufficient supply of the new CPUs. So are we going to see a corresponding 25 per cent boost in performance, or indeed anything close to it?
Let's begin to answer that by briefly discussing our test setup, before we start looking at some content creation results and then move into the gaming benchmarks. We tested each processor on our standard Windows 10 installation, updated to the most recent version (2004) to ensure that all of the latest security fixes and CPU topology awareness improvements are in place. The most recent AMD chipset drivers were also installed. Each app and game we tested was installed to fast NVMe storage, in this case the Samsung 970 Evo 2TB provided by Box.
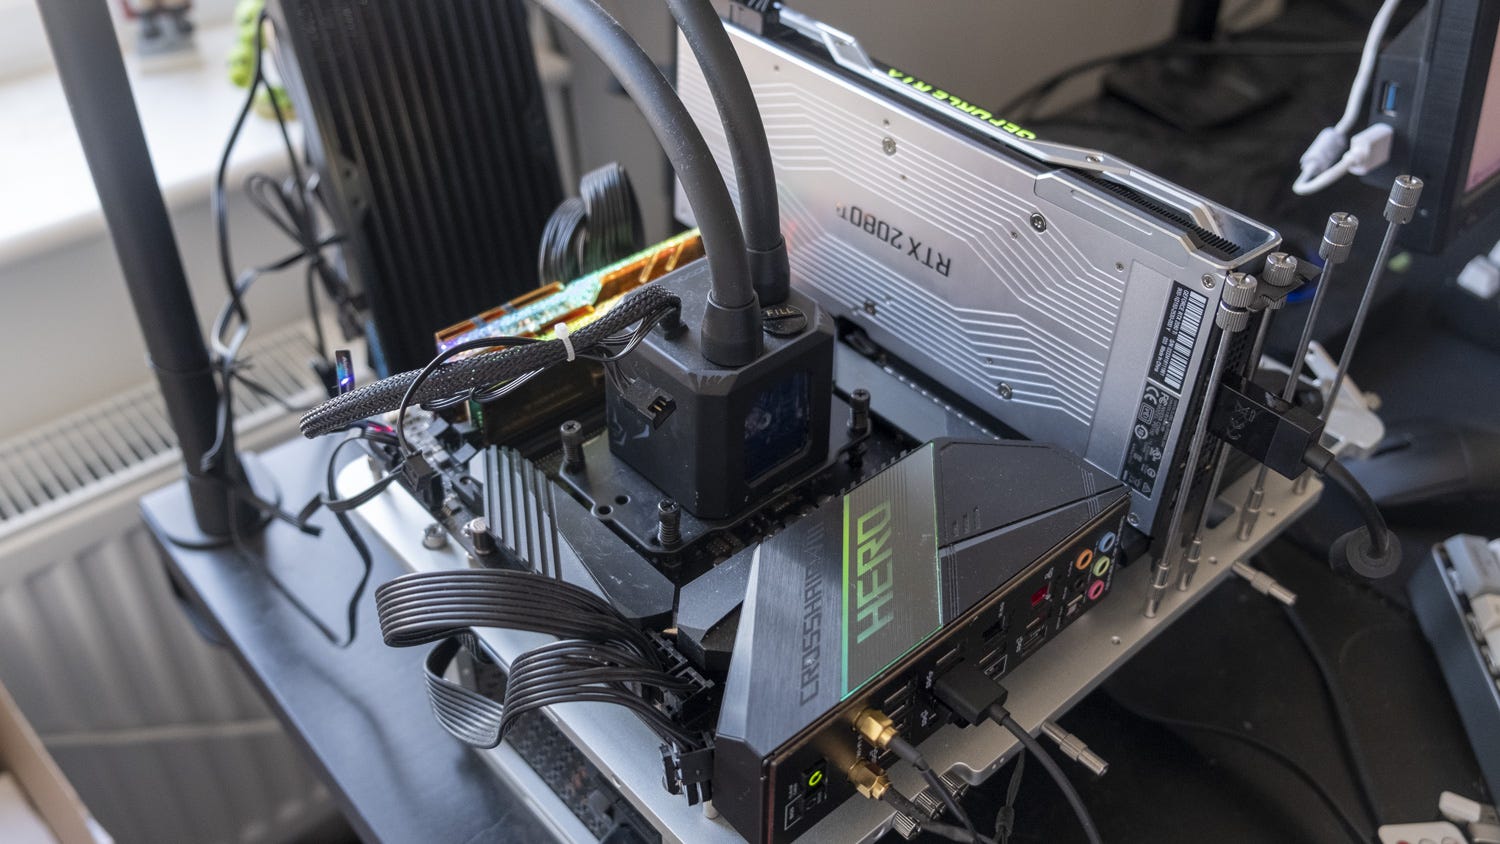
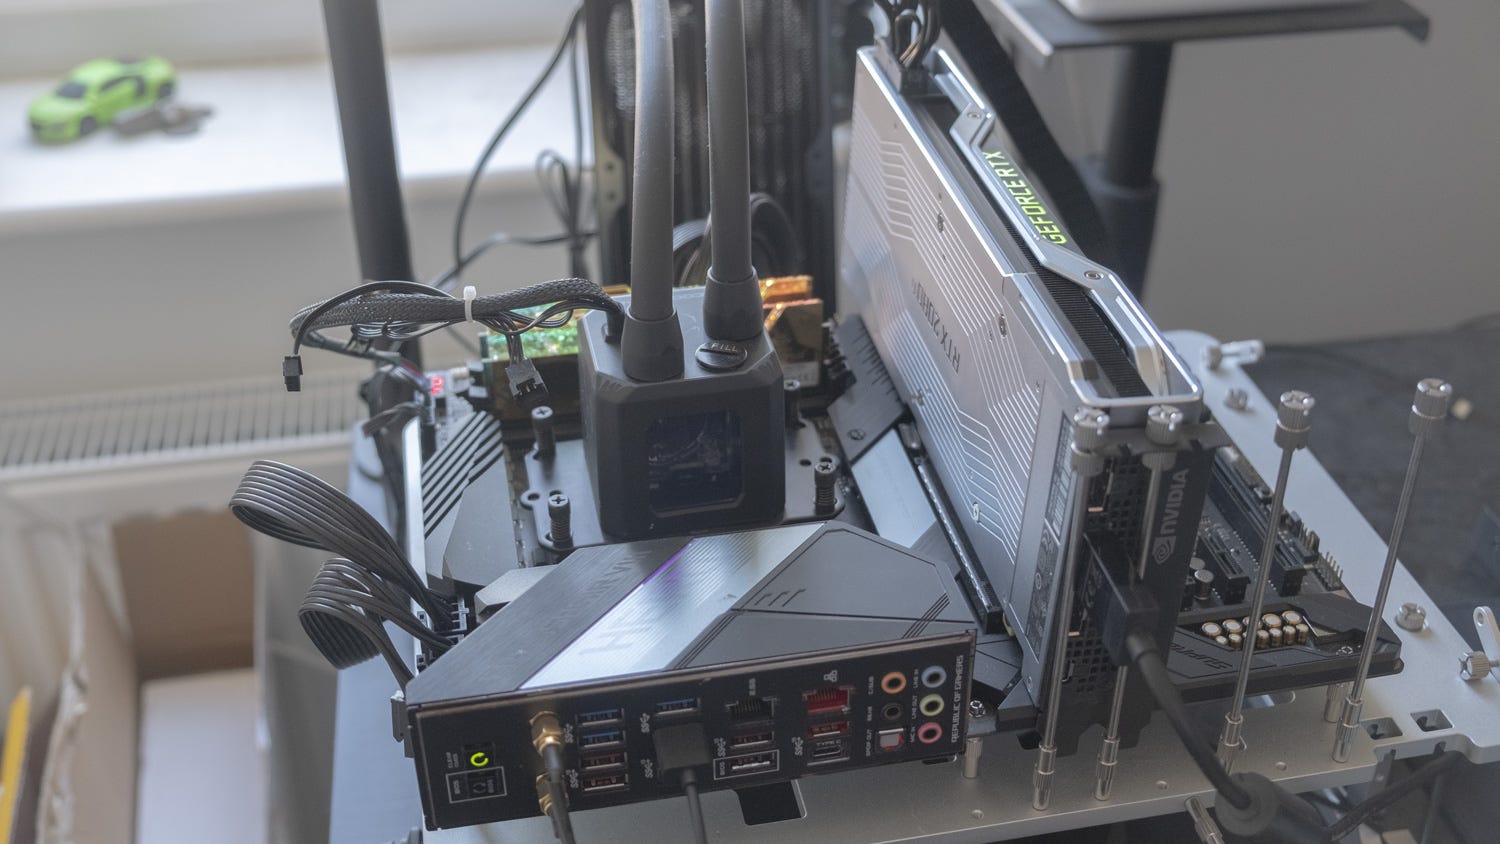
We performed our Ryzen 5000 testing on the Asus ROG Crossfire 8 X570 motherboard, one of four available options with compatible BIOSes available pre-launch, with additional AMD testing on the Asus ROG Strix B550-F Gaming Wi-Fi. For our Intel chips, we used the MSI MPG Gaming Carbon Wifi, with our ninth-gen results on the Asus ROG Maximus 11 Extreme.
In all cases, we used G.Skill Trident Z Royal 3600MHz CL16 RAM, set to its XMP profile in the BIOS, a spec that hits the current performance sweet spot. Overclockers and Alphacool provided the Eisbaer Aurora 240mm AiO liquid coolers used for our testing, while our PSU is an 850W unit from Gamer Storm. Finally, we used an Nvidia RTX 2080 Ti for our testing, as RTX 3080 cards remain in short supply.
Right - with that preamble out of the way, let's get into the content creation results. We tested the two Ryzen 5000 processors sampled to us against a selection of Intel and AMD competitors in two scenarios: rendering a 3D scene in professional graphics package Cinema 4D, simulated by Cinebench R20, and encoding one of our high quality Patreon videos into both h.264 and h.265 (HEVC) formats using the Handbrake video transcoder app.
Cinebench tests both single and multi-threaded performance, and often proves a good predictor of trends we'll see in the later gaming results. AMD promised increased single-core performance, and by George did they provide just that. The 625 and 638 single-core scores recorded by the Ryzen 5800X and 5900X are the highest we've ever seen, leading the previous AMD champ (the 3800XT) by 18 per cent and the best Intel chip (the 10900K) by 17 per cent.
Multi-threaded performance here is also impressively high, with the 6185 score managed by the 5800X coming very close to the 3900X's 7032 - despite the new chip having 50 per cent fewer physical cores. It's also within spitting distance of the 10900K, a 10-core CPU also known for its great single-core performance, which manages a score of 6337. The 5900X manages 8564 in the same test, a powerful result that exceeds the 10900K by 35 per cent. This is a strong early indicator that these CPUs will live up to AMD's big claims.
| CB R20 1T | CB R20 MT | HB h.264 | HB HEVC | HEVC Power Use | |
|---|---|---|---|---|---|
| Ryzen 9 5900X | 638 | 8564 | 60.49fps | 25.42fps | 219W |
| Ryzen 7 5800X | 625 | 6185 | 43.72fps | 19.41fps | 214W |
| Ryzen 9 3950X | 514 | 9249 | 64.73fps | 25.59fps | 296W |
| Ryzen 9 3900XT | 538 | 7101 | 51.91fps | 20.49fps | 221W |
| Ryzen 9 3900X | 514 | 7032 | 51.80fps | 20.29fps | 228W |
| Ryzen 7 3800XT | 540 | 5164 | 37.14fps | 15.83fps | 177W |
| Ryzen 7 3700X | 494 | 4730 | 35.05fps | 14.67fps | 152W |
| Ryzen 5 3600X | 490 | 3705 | 27.54fps | 11.81fps | 149W |
| Ryzen 3 3300X | 503 | 2577 | 18.89fps | 8.25fps | 120W |
| Ryzen 3 3100 | 449 | 2328 | 17.32fps | 7.44fps | 118W |
| Ryzen 7 2700X | 408 | 3865 | 27.31fps | 10.04fps | 224W |
| Ryzen 5 2600 | 399 | 2810 | 20.39fps | 7.09fps | 130W |
| Core i9 10900K | 545 | 6337 | 45.55fps | 19.43fps | 268W |
| Core i5 10600K | 493 | 3587 | 26.40fps | 11.84fps | 177W |
| Core i9 9900K | 520 | 5090 | 37.87fps | 16.22fps | 266W |
| Core i7 9700K | 486 | 3759 | 28.77fps | 13.12fps | 171W |
| Core i5 9600K | 450 | 2603 | 20.70fps | 9.46fps | 132W |
Looking at the Handbrake results, where we're transcoding an MP4 video to h.264 and HEVC using the Production Standard preset and CRF 18 quality setting, it's a similar story with major increases across the board for Ryzen 5000. The 5900X's HEVC encode rate of 25.42fps effectively ties the 3950X at 25.59fps, an insane coup considering that the 3950X is a 16-core part and the 5900X has only 12. The h.264 results are a little more distant, with the 5900X managing 60.49fps to the 3950X's 64.73fps, but it's still a respectable 17 per cent increase over the 51.80fps we saw for the 3900X last year.
We also measured power consumption in these tests, which makes these achievements even more impressive. The Ryzen 5900X achieved its excellent HEVC result with total system power consumption measured at 220W, compared to 214W for the 5800X, nearly 300W for the 3950X and 268W for the 10900K.
These are impressive results, so let's see whether they translate into gaming performance. We'll test each chip in a range of games at 1080p, 1440p and 4K, where we expect to see the greatest differences at 1080p because we'll be most CPU-bound in that scenario.
Each processor has been paired with the RTX 2080 Ti, as our current workload hasn't permitted a full retest with the RTX 3080 - which remains in short supply anyway. These results should still be illuminating even if you're on a slower GPU though, as we'd expect similar gaps in performance even from mainstream GPUs at 1080p. To give you some context, an RTX 2080 Ti at 4K (as tested here) provides roughly equivalent performance to a GTX 1660 running at 1080p. Higher resolutions, like 1440p and 4K, ought to be more dependent on GPU performance - especially in the challenging game scenes we've selected - but differences from CPU to CPU can still crop up, so do look at the full range of results. Likewise, we encourage you to take a look at other Ryzen 5000 reviews out there on YouTube and the web to gain a more comprehensive understanding of how these processors perform in a wider range of scenarios.
With all that said, let's get started!
AMD Ryzen 9 5900X and Ryzen 7 5800X analysis
- Introduction, hardware breakdown, test system [This Page]
- Gaming benchmarks: Assassin's Creed Odyssey, Battlefield 5, Far Cry 5
- Gaming benchmarks: Crysis 3, Metro Exodus, Kingdom Come Deliverance, The Witcher 3
- Gaming benchmarks: Memory bandwidth analysis
- AMD Ryzen 9 5900X and Ryzen 7 5800X: the Digital Foundry verdict