Radeon RDNA vs GCN: how much faster is AMD's next-gen architecture?
Performance rated teraflop for teraflop: what could it mean for PS5 and Scarlett?

This is a project I've been wanting to work on for a long time - since it became clear that AMD's brand new Navi architecture would feature in the next-gen consoles, in fact. From PS4 and Xbox One, through the enhanced consoles and up to the reveal of Google Stadia, graphics power has been measured by a somewhat arbitrary unit: the teraflop. And let's be clear: how many teraflops the new consoles have remains a preoccupation for many observers, eager to get some idea of what PlayStation 5 or Project Scarlett may deliver up against the hardware of today. But perhaps the focus needs to shift and maybe we need to take a closer look at the new AMD Navi architecture itself. Put simply, a teraflop of Navi compute should produce much faster game performance than an old-school GCN equivalent - but can we quantify that?
Testing Navi - and its teraflops - sounds like a relatively simple task. You'd start by tracking down graphics cards across the last seven years of AMD history, starting all the way back at GCN 1.0, the architectural foundation of the GPUs found in the current generation of consoles. From there, we'd equalise shader count, core clocks and memory bandwidth across the various GCN iterations and stack them up against a similarly specced Navi. After completing a thorough range of benchmarks, we'd have a progression of AMD performance improvements from the dawn of GCN right up to the brand new RDNA products - and at the end of it, maybe we'd get some idea of how a GCN 1.0 teraflop compares against an RDNA 1.0 equivalent.
Unfortunately, carrying out this procedure is somewhat difficult because equalising frequencies, compute units and memory bandwidth is essentially impossible. The GCN era began with Tahiti - a 32 compute unit GPU, while Navi's lowest end offering has 36 CUs. Further complicating matters is that Navi's GDDR6 VRAM offers a vast 448GB/s of bandwidth - way beyond the limits of any kind of comparable GCN part, with no obvious means of underclocking it. However, a tip from the brilliant Steve Burke at Gamers Nexus pointed me towards MorePowerTool, which I found could underclock memory to 256GB/s - the upper-end of GDDR5's capabilities on prior GCN products. With that hurdle overcome, some mathematical shenanigans can get us to where we need to be, as this table demonstrates.

| Architecture | Shaders/CUs | Bandwidth | Launch | Product Used | |
|---|---|---|---|---|---|
| Tahiti | GCN 1.0 | 2048/32 | 288GB/s | Dec 2011 | R9 280X |
| Polaris 10 | GCN 4.0 | 2048/32 | 211-224GB/s | Jun 2016 | RX 570 |
| Polaris 10 | GCN 4.0 | 2304/36 | 224-256GB/s | Jun 2016 | RX 580 |
| Navi 10 | RDNA 1.0 | 2304/36 | 448GB/s | Jul 2019 | RX 5700 |
We can't compare GCN 1.0 to RDNA 1.0 directly, but we can do the next best thing. The original Graphics Core Next silicon, codenamed Tahiti, is represented here by the Radeon R9 280X with 32 compute units. Its 384-bit memory interface tops out at 288GB/s of bandwidth and can be easily underclocked to 256GB/s. Moving onto the evergreen Polaris architecture, the Radeon RX 570 has the same CU count, and its RAM can be overclocked to 256GB/s. The plan is starting to come together - we can compare GCN 1.0 and GCN 4.0 directly.
However, working back from the top-end, the RX 5700 has 36 compute units, which presents a problem. We can underclock the GDDR6 to reach 256GB/s of bandwidth, but we have four more CUs than our other cards. This is where our final GPU proves crucial - the Polaris-powered RX 580 has the same CU count as Navi and comes with the required 256GB/s of memory bandwidth straight out of the box. In short: we can't compare GCN 1.0 to RDNA 1.0, but we can compare Tahiti to Polaris and Polaris to Navi, establishing a chain between architectures and using those two figures, project the percentage gain a 32 CU version of Navi would likely bring.
This leaves just one more minor challenge - matching core frequency. Our MSI R9 280X tops out at 1050MHz, so I settled on a round 1.0GHz clock for all cards. The RX 5700 clock does wander a little, even when drastically underclocked to this level, but not to any degree that's likely to unduly compromise the result. Game on - but now the next challenge is to figure out what we're actually going to test on all four cards.

| Tahiti/32CUs | Polaris/32CUs | Polaris/36CUs | Navi/36CUs | |
|---|---|---|---|---|
| 3DMark Firestrike DX11 | 9197 | 11299 | 11991 | 14153 |
| 3DMark TimeSpy DX12 | 2279 | 3149 | 3696 | 5035 |
There's a lot to cover here and we're starting with some synthetic benchmarks to set the stage. But before we go on, let's just stress that this is an architectural performance analysis and not representative of the actual products - remember that we've altered core clock, memory bandwidth or both (sometimes quite drastically) in order to get an idea of how AMD's graphics technology has evolved over the last seven years.
3DMark's graphics scores on its established Firestrike DX11 and TimeSpy DX12 benchmarks are our first port of call. Firestrike shows a 23 per cent boost in throughput between Tahiti and Polaris, and a lesser 18 per cent uplift from Polaris to Navi. End to end, by stacking up those two percentage gains, the improvement is around 45 per cent overall. The usefulness of 3DMark is often called into question, but as we'll see on the next page, this figure is close to actual gaming performance under DirectX11.
TimeSpy stress-tests a card's DX12 credentials and produces an eye-opening result. Polaris beats Tahiti by 38 per cent, while Navi exceeds Polaris by 36 per cent. From one end of AMD's recent GPU history to the other, and factoring out Navi's extra CUs, Navi delivers a vast 88 per cent improvement over Tahiti - and again, this is reflected in many of our DX12 gaming results. The question is: are we looking at a genuine architectural improvement here though, or is Tahiti simply lacking a decent DX12 implementation by today's standards?
| Tahiti/32CUs | Polaris/32CUs | Polaris/36CUs | Navi/36CUs | |
|---|---|---|---|---|
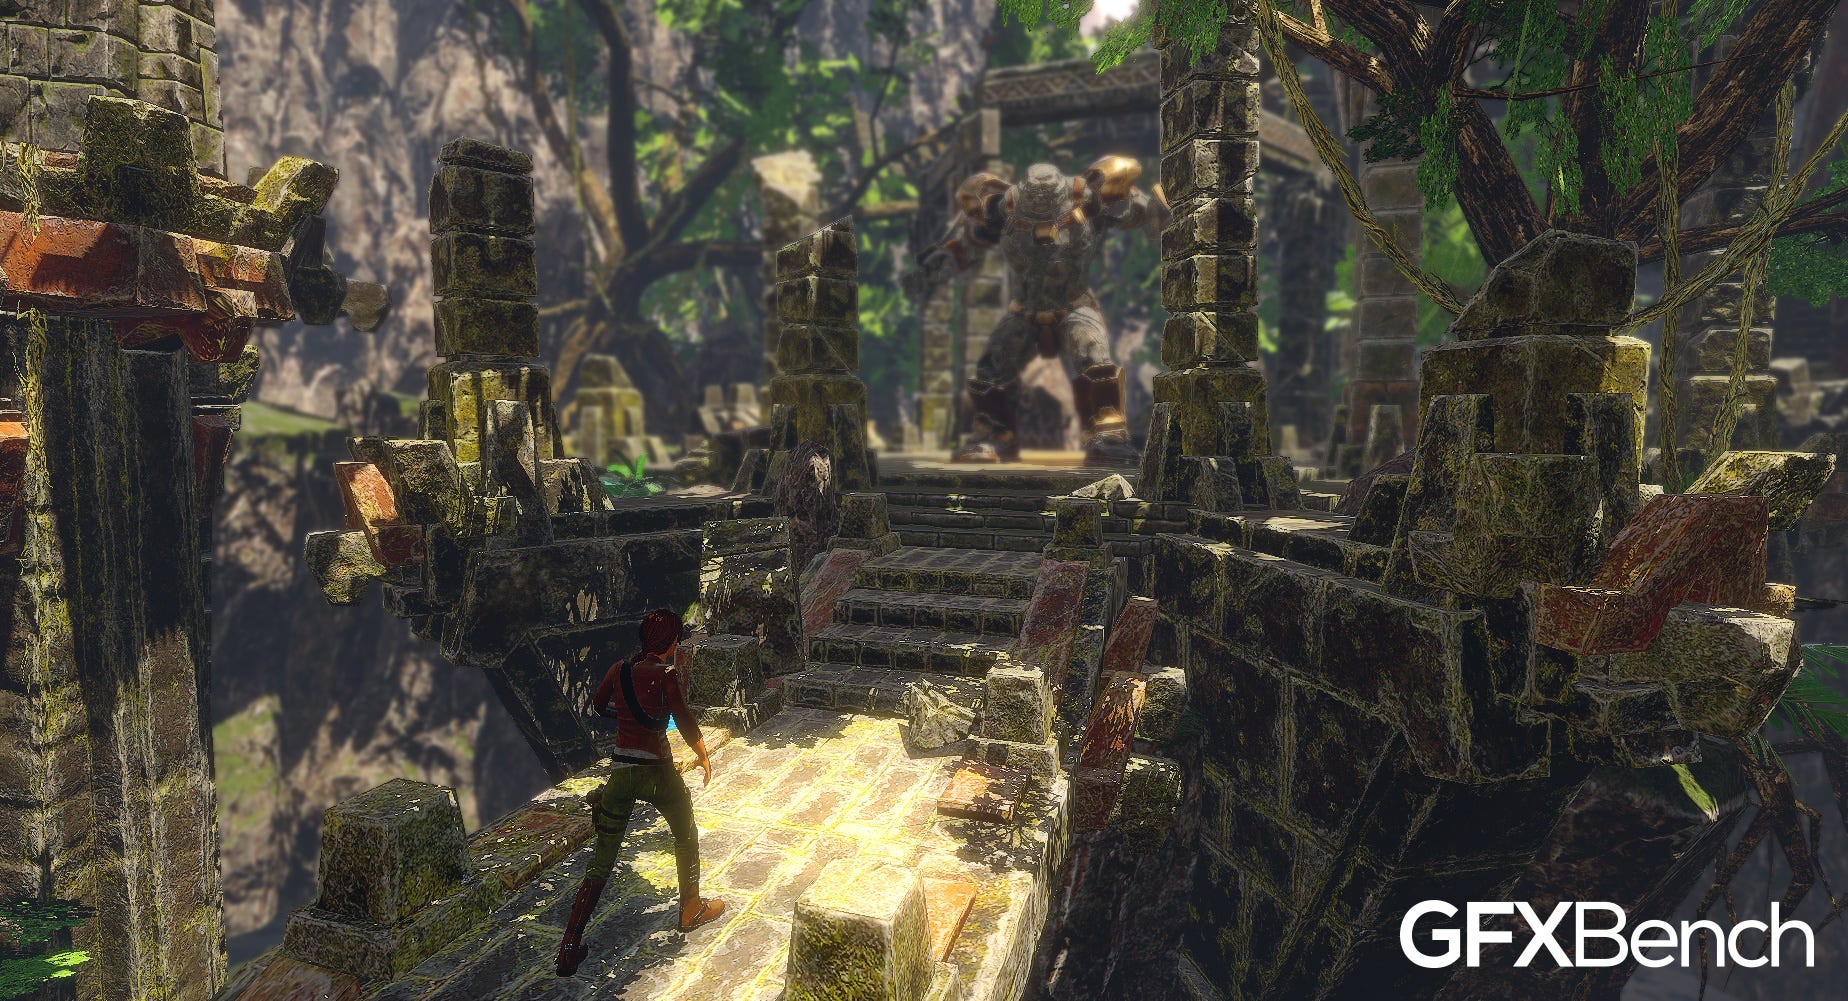
| GFXBench Tessellation | 111fps | 711fps | 718fps | 947fps |
| GFXBench ALU2 (Compute) | 655fps | 825fps | 913fps | 1178fps |
Spoilers: we're going to see some crazy results running the same workloads across the AMD generations over the next few pages, where the GCN 1.0 technology is going to fall short of both Polaris - and especially Navi - owing to its far more limited feature set and lower levels of raw horsepower. And that's where the GFXBench OpenGL benchmarks above may prove illuminating. Polaris vs Tahiti sees a 28 per cent increase in compute power, despite identical levels of rated compute and memory bandwidth. Navi vs Polaris sees another leap of the same magnitude. From Tahiti to Navi, a notional 32 CU part based on the new architecture would deliver a 62 per cent improvement in compute power.
I've also included the tessellation result as an example of AMD has beefed up geometry processing over the years. We know about game benchmarks being limited by compute power, ROPs or memory bandwidth - but could we see games being held back simply by triangle set-up? Yes indeed. The numbers speak for themselves here, but essentially from a 32 CU Tahiti to a 36 CU Navi, this aspect of AMD's architecture has seen an 8.5x increase in seven years - while totting up architectural gains from generation to generation to generation, there's a 745 per cent performance uplift.
Now it's time to apply the same methodology to a range of games. The results are interesting, but not as consistent or as clear-cut as you might imagine.
AMD RDNA vs GCN Analysis:
- Introduction, video analysis, synthetic benchmarks [This Page]
- Gaming benchmarks DX11: AC Unity, Crysis 3, Ghost Recon Wildlands, Far Cry 5
- Gaming benchmarks DX12: Rise/Shadow of the Tomb Raider, Strange Brigade, Wolfenstein 2
- Gaming benchmark problem children: Battlefield 1, Forza Horizon 4, The Witcher 3
- AMD architecture: Navi memory bandwidth scaling and conclusion