Nvidia GeForce RTX 2080 Ti benchmarks: the new top card tested
Even without taking ray tracing into account, the 2080 Ti still impresses.
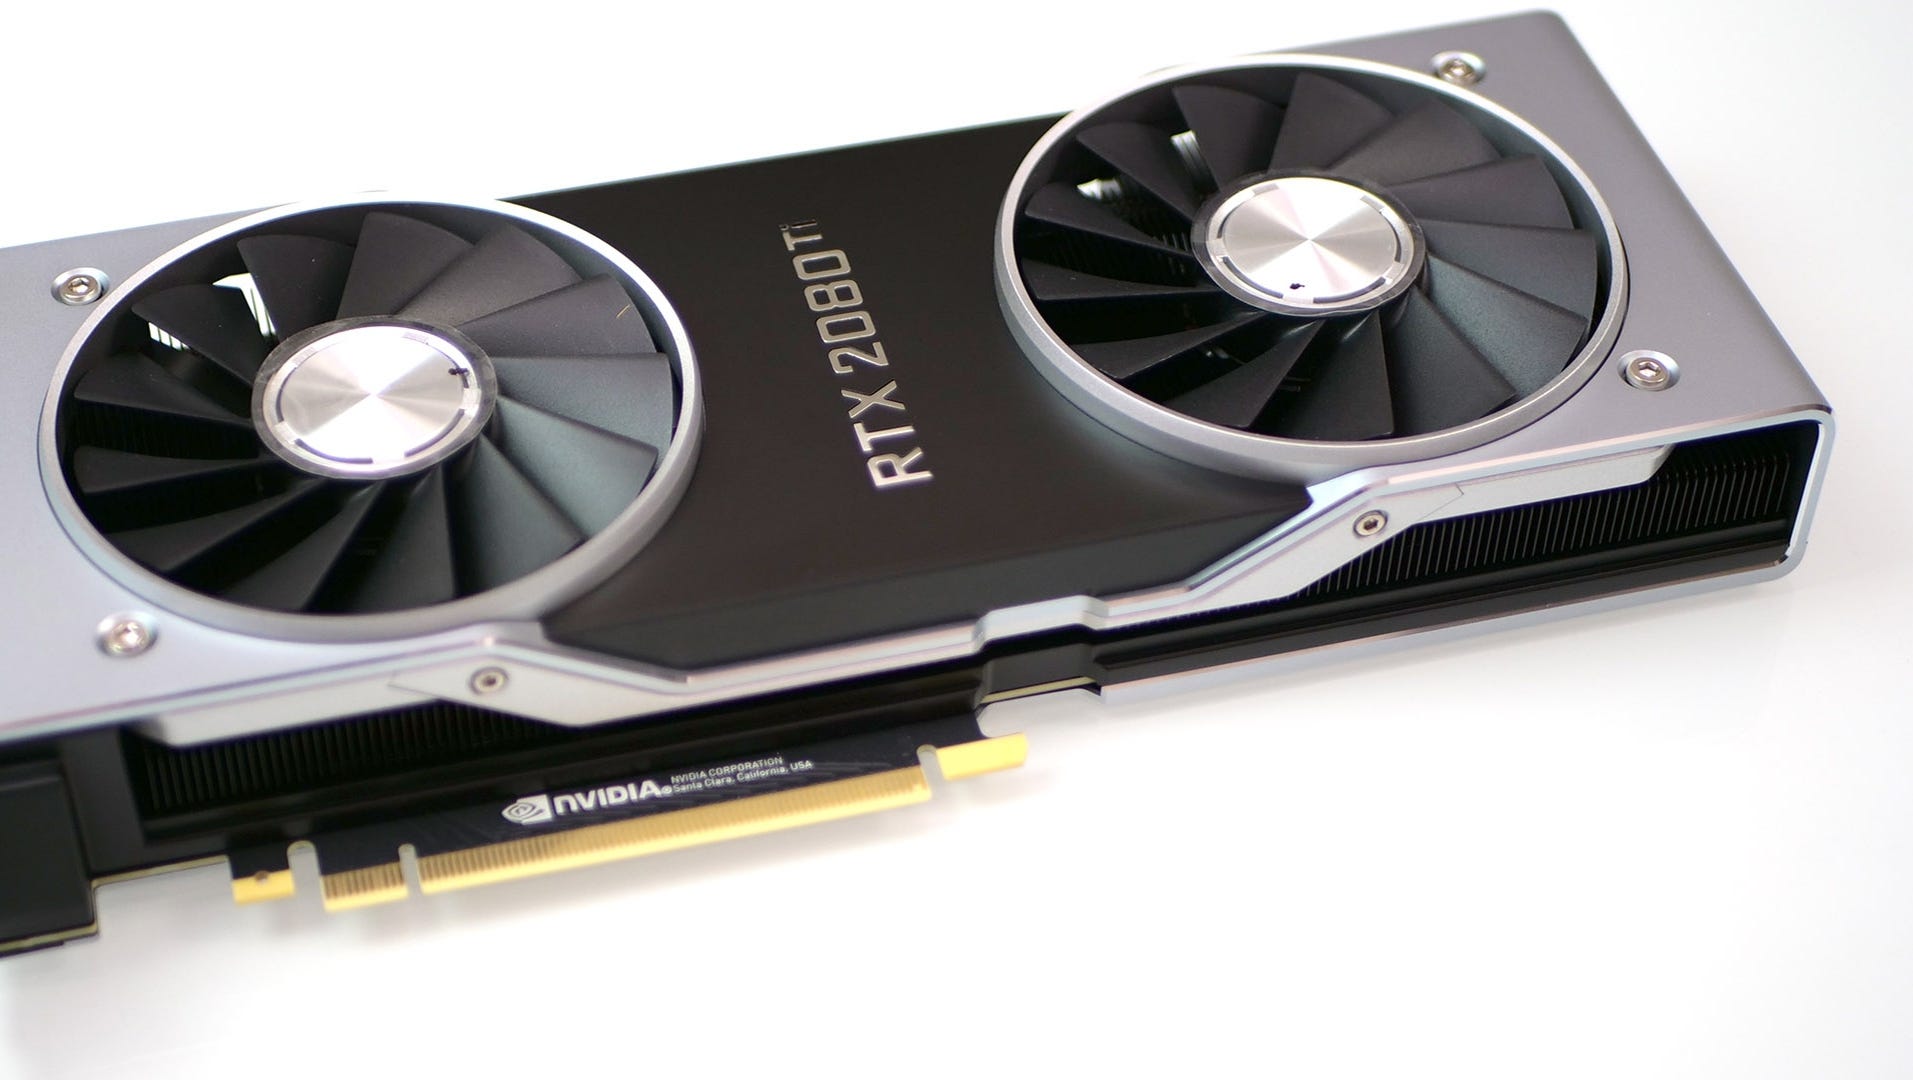

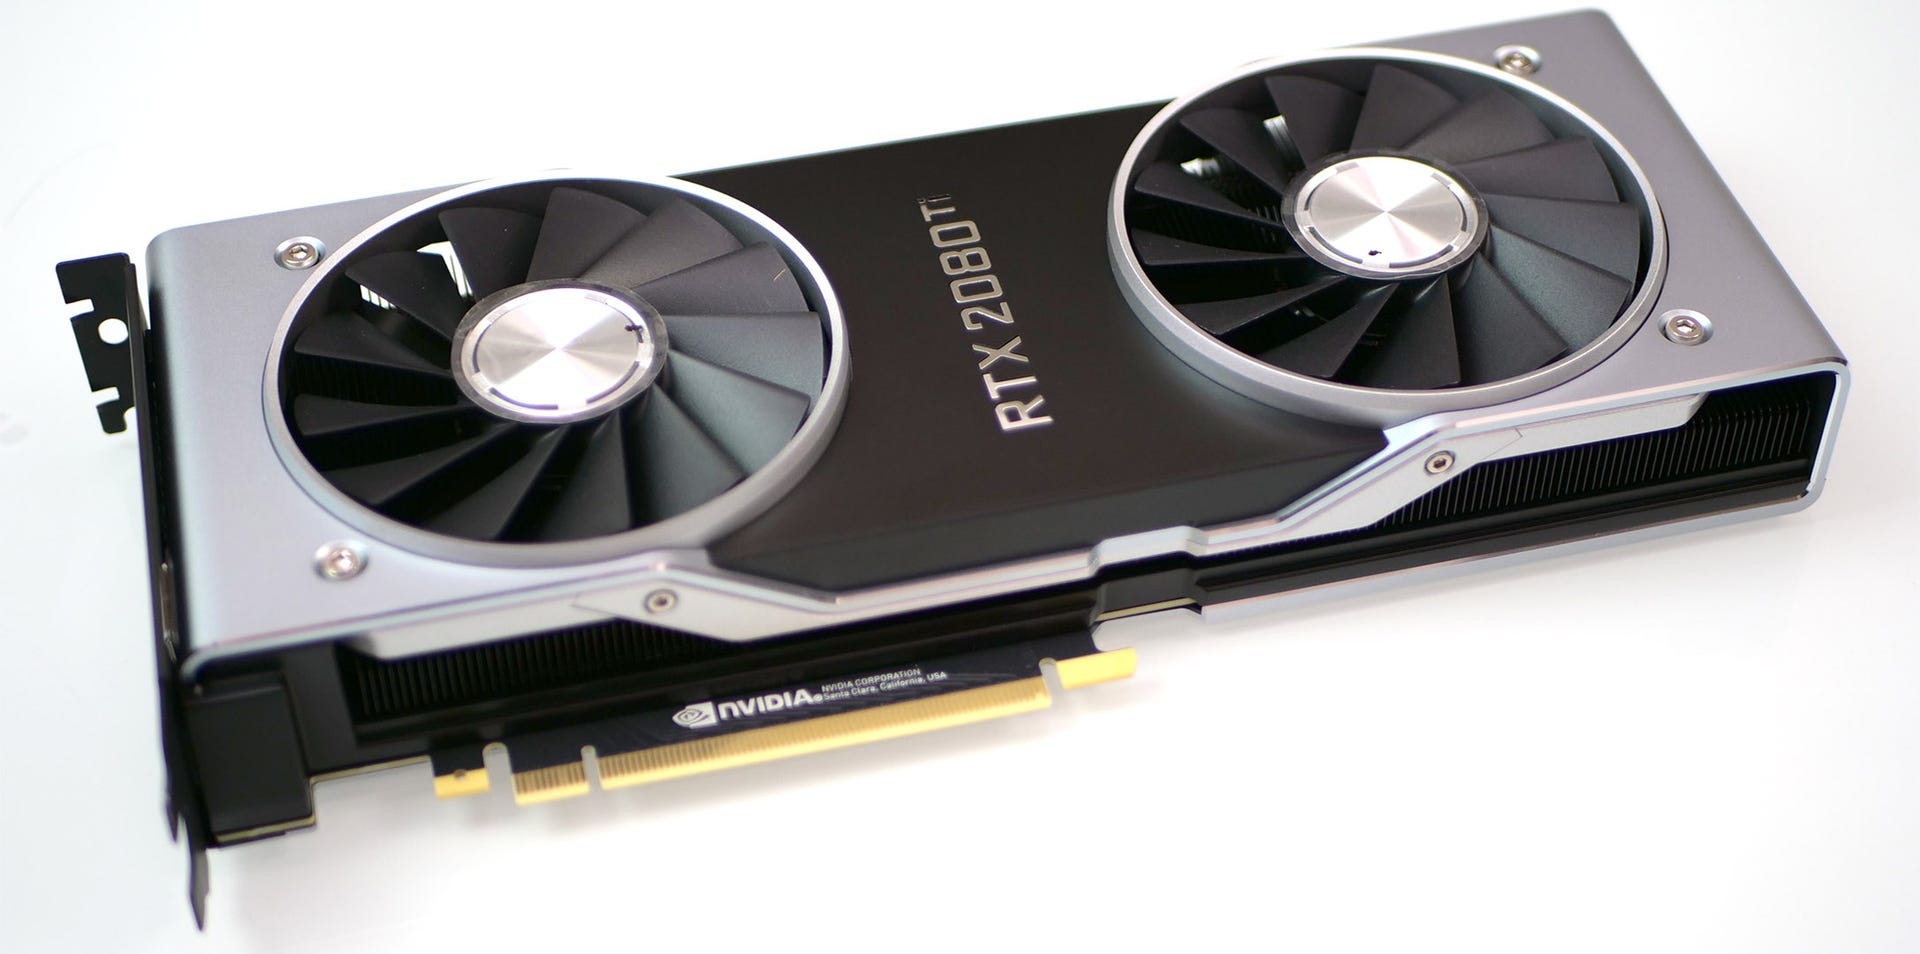
The RTX 2080 Ti is the fastest consumer graphics card that Nvidia have ever made, a Titan in all but name and the go-to choice for all-out performance. The bulk of Nvidia's marketing has targeted its new capabilities, like real-time ray tracing (RTX) and deep learning super-sampling (DLSS), and these are exciting topics with the potential to change the industry to be sure. However, we wanted to know how the RTX 2080 Ti and RTX 2080 actually perform in real games, ones which haven't yet added support for Nvidia's latest and greatest technologies - so we've tested nine popular PC titles from the past few years to show you exactly the level of performance you should expect.
After all, even setting aside the new features of the RTX cards, there's still a simple need for faster GPUs that are better able to cope with higher resolutions and higher refresh rates. Even the previous highest-end consumer card, the GTX 1080 Ti, struggles to run all games at 4K resolution and 60 frames per second once the graphical fidelity dials are cranked all the way up. Moreover, the recent arrival of relatively affordable 4K 144Hz monitors means that there's always room for GPU performance improvements. Thankfully, the RTX 2080 Ti absolutely delivers, offering at least 20 per cent better performance than the GTX 1080 Ti in almost all titles, and sometimes much more.
While the focus of this article is on the raw performance numbers - see our GeForce RTX 2080 and 2080 Ti review for the full story - we will also briefly examine DLSS performance as well. That's because this technique can allow for potentially massive performance gains on top of what the RTX series cards already provide, and this new tech has already been confirmed for 28 titles - although only a handful have actually appeared in the months after the 2080 Ti's launch.
Which GPUs are worth buying? We've made our picks for the best graphics cards available, updated with the latest graphics cards as they're released. As well as an overall performance champ, we name the best value graphics card and best cheap graphics card to guide your next upgrade.
In our testing, we'll compare the RTX 2080 Ti against the RTX 2080 and the leading 10-series cards, the GTX 1080 Ti and GTX 1080. We'll also throw in AMD's newly released graphics card, the Radeon 7. We've focusing our testing at 1440p and 4K resolution, as these high-end cards would be overkill for almost all titles at 1080p. It's also worth mentioning that the RTX cards are Founders Editions cards which come factory-overclocked by Nvidia, while the previous generation of reference designs came at stock clocks.
| RTX 2080 Ti | RTX 2080 | GTX 1080 Ti | GTX 1080 | Radeon 7 | |
|---|---|---|---|---|---|
| GPU cores | 4352 | 2944 | 3584 | 2560 | 3840 |
| Giga Rays/sec | 10 | 8 | 1.21 | 1? | ? |
| RTX-OPS | 78T (76T) | 60T (57T) | 12T | 8T | ? |
| VRAM | 11GB GDDR6 | 8GB GDDR6 | 11GB GDDR5X | 8GB GDDR5X | 16GB HBM2 |
| Memory Bus | 352-bit | 256-bit | 352-bit | 256-bit | 4096-bit |
| Mem. Bandwidth | 616GB/s | 448GB/s | 484GB/s | 352GB/s | 1024GB/s |
| Base Clock | 1350MHz | 1515MHz | 1480MHz | 1607MHz | 1400MHz |
| Boost Clock | 1635MHz (1545MHz) |
1800MHz (1710MHz) |
1582MHz | 1733MHz | 1800MHz |
| TDP | 260W (250W) | 225W (215W) | 250W | 180W | 300W |
The table above includes the Founders Edition figures, with the reference equivalents in parentheses.
You'll see data on how each card performs thanks to our unique Digital Foundry benchmarking system - as long as you're viewing the desktop version of this page, anyway. A YouTube video will show you the scene that we tested each card on, with live frame-rate and frame time data embedded below.
This is a substantial advantage over the old system of hard-coding the telemetry into each video, as this way you can use the controls to the right of the video to add or remove different cards and resolutions. Perhaps you'd like to see how the new RTX cards stack up against their Nvidia predecessors, or maybe you want to see the gulf in performance between the Vega 64 and Nvidia's latest. With these controls, you can do just that - and more.
Below the real-time telemetry, you can find summaries for the entire run, including the incredibly useful lowest one per cent and lowest five per cent figures, which give you an idea of the stability exhibited by each graphics card during our runs. To see these different figures, mouse over the image and watch as the readings change accordingly. You can also click the chart to toggle between absolute figures and percentages.
Alright, now that you know what to expect, let's get right into the results.
Assassin's Creed Odyssey
We begin with Assassin's Creed Odyssey, the latest game in these charts to be released and to be added to our benchmark suite. The game's phenomenal textures and materials, combined with the large open world, make for a stern test even for the RTX 2080 Ti. The RTX 2080 Ti is able to manage 75fps at 1440p, but only 52fps at 4K - so if you want a 4K/60 experience, you'll need to stump up for a second RTX 2080 Ti in your system, get an ever faster CPU than our 4.7GHz Core i7-8700K or - perhaps most sensibly - turn down the graphical settings just a tad. The RTX 2080 Ti is 22 per cent faster at 4K than its closest competitor, the RTX 2080.
AC Odyssey: Ultra High, TAA
Assassin's Creed Unity
Our second game is a classic choice that places high demands even on modern graphics cards: 2014's Assassin's Creed Unity. The RTX 2080 Ti is the very first card we've tested to average more than 60fps at 4K, with a result that just barely squeaks over the line. Meanwhile, the RTX 2080 turns in performance in a similar league to last year's GTX 1080 Ti at around 45fps. AMD's highest-performing card, the Radeon 7, is more competitive than its Vega predecessors but only manages 40 frames per second at 4K by comparison. AMD hardware in general struggles with the game's depth of field effect, explaining the wide variance in the Vega card's results here.
AC Unity: Ultra High, FXAA
Battlefield 1
Battlefield 1, released in 2016, comprises our next test. It's worth noting that the game lacks a built-in benchmark, so we're taking a section from the game's campaign as our British tank trundles dutifully across French no man's land, explosions (and therefore, randomised frame-time spikes) everywhere. However, the performance exhibited should be representative, with RTX 2080 Ti showing a commanding lead of 32 per cent over the RTX 2080 thanks to its average frame-rate of over 100fps. (That means the card could actually make some use of a 4K monitor running at 144Hz!) This benchmark also marks the finest hour for the Radeon 7, with the card hitting an 85fps average which is eight per cent ahead of the RTX 2080. Unlike our last test, the RTX 2080 pulls ahead of the GTX 1080 Ti here, with about a 12 per cent margin. The GTX 1080 brings up the rear, managing a respectable 60fps at 4K.
Battlefield 1: Ultra, TAA
Crysis 3
But... can the RTX cards run Crysis? Yup! The RTX 2080 Ti is the first consumer card we've tested able to best this 2013 game at 4K, with a smooth result of 68fps. The RTX 2080 and GTX 1080 Ti are close behind, scoring 53fps at 4K, enough for an eight per cent lead over the Radeon 7. The GTX 1080 manages 41fps in the test, a decent average but one that is now outclassed by the card's competitors.
Crysis 3: very high, SMAA T2X
Far Cry 5
Far Cry 5 was the first new game to be added to our benchmarks in 2018, replacing 2016's Far Cry Primal. The title, released in March of that year, is a stern test for any graphics card thanks to its detailed representation of the mythical Hope County and frenetic open-world action as the player tries to push back the Peggies and finish all of the open-world tasks they can find. The RTX 2080 Ti goes 25 per cent faster than the RTX 2080, and 33 per cent faster than the GTX 1080 Ti it replaces. It's also the only card able to push an average frame-rate of more than 60fps. The Radeon 7 technically outperforms the RTX 2080, but there's only a fractional difference between them - well within the margin of error.
Far Cry 5: Ultra, TAA
Ghost Recon Wildlands
2017 open-world shooter Ghost Recon Wildlands remains the most stressful test we've got at the moment, with an absolutely devastating ultra detail quality preset that has brought every card we've tested it with to its knees. Even the RTX 2080 Ti isn't capable of delivering 60fps at 4K here, turning in just 47fps on average. Mind you, that's still a healthy 23 per cent ahead of the RTX 2080, 24 per cent ahead of the GTX 1080 Ti and 26 per cent ahead of the Radeon 7. If you are gaming on 4K, we'd recommend using a G-Sync monitor to smooth out the experience or turn down the detail settings to high or very high to attain a 60fps result.
Ghost Recon Wildlands: Ultra, TAA
Rise of the Tomb Raider
Lara Croft's 2016 outing, Rise of The Tomb Raider, is a gorgeous game with a three-part benchmark makes it a great choice for performance testing. The game runs at an comfortable 80fps on the RTX 2080 Ti, around 30 per cent faster than the RTX 2080 but only 27 per cent faster than the GTX 1080 Ti. The GTX 1080 finishes last once more, offering only about 60 per cent of the performance of our highest-end card. It's worth remembering that this benchmark should only be used to judge relative performance between GPUs; actual gameplay is significantly more demanding.
Rise of the Tomb Raider: Very High, SMAA
Shadow of the Tomb Raider
Our second new benchmark comes from 2018 release Shadow of the Tomb Raider, which sees Lara Croft and shadow-org Trinity face off once more. Unsurprisingly, the new game's benchmark is more challenging than its predecessor, but it's also a better indicator of actual in-game performance. Here, only the RTX 2080 Ti manages to turn in an average result about 60fps at 4K, at least with the demanding settings that we've chosen. The RTX 2080 Ti leads the RTX 2080 by 31 percent, while the lead over the GTX 1080 Ti is 42 per cent. It's also worth bearing in mind that these results on the RTX cards could be further improved by DLSS, which could see even the RTX 2080 hit 60 frames per second at 4K.
Shadow of the Tomb Raider DX12: Highest, TAA
The Witcher 3
The Witcher 3, released in 2015, remains a favourite in 2018 for RPG fans and PC hardware testers alike. If you've decided to take on the hard life of a Witcher, then listen up: the RTX 2080 Ti delivers far and away the best performance here. It does it by a comfortable margin too, recording a score of 77fps compared to 60fps for the RTX 2080, 59fps for the Radeon 7 and 57fps for the GTX 1080 Ti. The GTX 1080 still manages a tolerable score just under 45fps, which could easily be managed with a G-Sync or FreeSync monitor.
The Witcher 3: Ultra, POST-AA, No Hairworks
Wolfenstein 2: The New Colossus
Our third and final new title is Wolfenstein 2: The New Colossus. This title came out in late 2017, and sees series stalwart BJ Blazkowicz embark on one of his zaniest - yet heartfelt - adventures yet. We've selected a section from the game's campaign which sees BJ astride the Panzerhund, giving the game's night-time visuals a chance to shine. There are relatively even gaps between each of the five cards we've tested here, with the RTX 2080 Ti holding a 35 per cent lead over the RTX 2080 and a 56 per cent lead over the GTX 1080 Ti.
Wolfenstein 2 Vulkan: Uber, TSSAA 8x
Final Fantasy 15: TAA vs DLSS
We'll close out with a test of the new DLSS tech that arrives on the new RTX cards in one of its supported titles, Final Fantasy 15. You can see our full RTX 2080 and 2080 Ti review for a more in-depth discussion of DLSS, but basically it works like this: a lower-resolution image is rendered, then upscaled by an efficient deep learning algorithm which has been trained on high-resolution game imagery. This allows the graphics hardware to deliver a final image that looks about the same or better at a fraction of the usual performance cost, ultimately allowing for higher frame-rates compared to more standard anti-aliasing methods.
You can see from the benchmark below that enabling DLSS delivers dramatically higher performance compared to traditional temporal anti-aliasing (TAA). The RTX 2080 result jumps nearly 40 per cent, with similar gains for the RTX 2080 Ti. Combined with the significant gap in raw hardware performance between the two card generations, the Final Fantasy 15 test shows an 80 per cent frame-rate leap with DLSS enabled, whether you're comparing the GTX 1080 and RTX 2080, or GTX 1080 Ti and RTX 2080 Ti. That's a stunning result, and DLSS looks set to be a game-changer if we see similar gains in other titles.
Final Fantasy 15 demo: TAA vs DLSS
With that, our look at the RTX 2080 Ti's benchmark results has come to an end.
For more on the RTX 2080 Ti, check out our full GeForce RTX 2080 and 2080 Ti review.
Now that you've seen the benchmarks for one card, why not check out see which PC hardware we recommend to our friends and family? Here are the DF picks for the overall best graphics cards and for the best gaming monitors on the market.